The Physics of Paintball
A theoretical treatment of paintball dynamics: drag, spin, trajectory and range.
A THEORETICAL TREATMENT OF PAINTBALL DYNAMICS
*My paintballs fly further than my friend’s; my WeedWhacker gun is better than his! *You guys all suck! I can hit a quarter three out of five times at 150 ft. *My gun gives the paintballs an extra push after they leave the barrel. *My SuperWhizzo marker shoots only a flat trajectory with a straight barrel.
Do any of these statements sound familiar? If you have ever read rec.sport.paintball usenet group, or are a regular at paintball fields you probably have heard them. These statements are scary, and often the rebuttals are just as scary. There are too many people who believe something magical occurs with some markers. Maybe it comes from watching too many alien visitation TV shows. Fortunately, there are always a few people who can provide a more balanced and thoughtful view. However, the demagoguery from both sides without substantiation often leads to confusion and ultimately mistrust of any statement by those who really want to know what the truth is.
There are at least two experimental studies that have really looked at the dynamics of what can happen to a paintball when it leaves the marker. Since the publication of these pages in 1999, I have hints of others, but the data will unlikely never be in the public domain. Unfortunately, the details of what is generally known is only available to the public in a condensed form (see here for one reference to part of a study). The second still has too mayloose parameters to effectively evaluate. Those of us who try for lucid armchair answers often rely on our imperfect memories of physics classes. As it turns out, high school physics courses often do not go far enough, and unless the college physics is the more advanced version for science majors, the dynamics of a flying paintball will still not match reality. In fact, even though I had advanced physics courses, I was not aware of some of the subtle dynamics that paintballs are subject to.
Before I discuss the physics, I would like to review a discussion that occurred in the rec.sport.paintball group in July of 1998, that I think we should all keep in mind. The arguments were again flying back and forth about whose gun is better and has a flatter trajectory. At one point a fellow named Terry Garrett made the statement “I think the most appropriate science that applies to paintball gun accuracy is the science of psychology. If you wish to call it a science. The more the barrel cost, the longer it is, and the more the manufacturer spent on advertising is what makes it the best.”
“Really, who does serious accuracy testing? We’ve all seen tons of posts over the years stating such data as “last Sunday I shot 5 guys with this new barrel when I usually only shoot 4 so it has to be more accurate.” etc, etc.....”
Now I don’t agree with all of this statement. I do think examining paintball motion from even a theoretical physics can explain some of the limitations and paintball behavior we see. However, I do believe that he was right about the psychology of paintball. There is too much reliance on one-of-a-kind episodes under all kinds of strange conditions.
Relying on manufacturers’ statement is in general not a good plan. Have you ever seen them back up their claims with hard evidence? Only Air Designs comes evenly mildly close. (Now don’t rush out and buy their guns just because I make this statements. We don’t know all about their study either.)
Except for the “mine is prettier than yours” people, we all want to believe that we spent our hard earned money to get the very best. We don’t like someone telling us our $1200 gun is just as accurate as a $150 gun. Without hard data, all we are left with is the psychology of the sport. To me, thats a dismal situation. Part of the reason for this document is to stop some of this all to prevelant attitude.
The Goals This set of pages is an attempt to sweep out at least a portion of the speculation and misunderstanding. It will examine the dynamics of paintball flight from a theoretical perspective. I wish there were more direct experiments on paintball dynamics. Real life experiments are always better than theoretical studies. Unfortunately, I do not have the time or funds to do the necessary experiments.
What These Pages Will and Won’t do For You. What could you get out of this? Will it make you a better player? No, not at all. In fact, if you stop to think about this stuff while your playing, you probably will get shot out. You won’t find here information on the best barrel, best marker, best paintball or best tactics.
What I hope these page can do is give you a better appreciation for all the factors that go into getting a paintball to a target. I hope it will make you a more aware player, less likely to fall for some of the blatantly misleading statements of your fellow players and some manufacturers. Most of what I discuss will be obvious to you from good old common sense and practical experience. What I hope to do is give you the framework behind those common sense notions. I will try and show you why paintballs act the way they do, and maybe alert you to some things to consciously avoid or do.
Now the Scary Part! I realized early in thinking about what I wanted to say here, that just making dogmatic statements isn’t going to convince the skeptics of anything. Thus, the nature of these pages is in the form of a small tutorial starting from basic physics Laws and Principles and working up very quickly to complicated formulations. This stuff is real meat and potatoes physics. That means that the discussion will very soon put us knee deep into heavy doses of physics. As I proceed, the discussion will sink us up to our necks into advanced math (calculus). Although I wish everyone could follow the math, I know that only a few will understand every last equation I write. I am not trying to bury anyone under jargon or an intellectual fog. Nevertheless, this document will undoubtedly come across as pedantic to a good number of paintball players. For those whose eyes begin glazing over when more than two numbers are multiplied together, I do try to discuss what the calculations mean. But please keep in mind that this is a long and detailed technical document. The logic and methods are presented in detail, so that anyone who has the necessary expertise can evaluate and criticize them. In my professional career, all my published work goes through a critical review process. The work here has not. You are my reviewers as well as my readers. Above all, I am interested in achieving an honest appraisal of the dynamics of paintballs.
In addition, I would like anyone interested in physics or aerodynamics to take note there may be some cute stuff here for you to think about. Hey, this stuff is only on the rim of my expertise; I certainly am missing many nuances of fluid dynamics. Second, there are some glaring questions that will become evident as I proceed, which present interesting opportunities for real world experiments by many of you.
From my personal perspective this is neat stuff! In trying to answer the questions of why paintballs act the way they do in the real world, I have finally begun to understand the classical dynamics I think my college professors tried to teach me a long time ago. Hey, its never to late!
Okay, here we go!
INTRODUCTION (The Stuff Starts Flying Now!) The kind of information needed to explore the flight of a paintball crosses several scientific disciplines. One is the classical dynamics of Isaac Newton, another is the field of fluid dynamics, more specifically aerodynamics. Ballistics is the name of the specific scientific field that encompasses the science areas that we need to address. It is the study of projectile motion. There are two separate areas of ballistics - exterior ballistics and interior ballistics. The latter deals with what happens to a projectile before it leaves the barrel or guiding mechanism. The former deals with what happens after the projectile leaves the barrel. Although what occurs before the paintball leaves the barrel is crucial to the flight or trajectory of the ball, it is beyond the scope of this article. A brief description as I see it from my armchair will hopefully set the stage.
While in the barrel, the paintball is being accelerated by the difference in pressure between the CO2 behind the ball and the air in front of the ball. The definition of pressure is force/unit area. Against this motivating force are several other forces. One is the drag of the ball against the barrel. Note that this force may not be uniform on the ball and depends on the condition (smoothness and shape) of the barrel, and on the smoothness and shape of the paintball. A second hindering force is the air drag in front of the ball. A third force is rotational torque that the gas or barrel may impart to the ball causing some sort of rotation.
Now as the ball leaves the barrel the situation changes dramatically. The gas pressure behind the ball drops to atmospheric pressure (How fast? I don’t know. I guess at the speed of sound). There is no longer any force pushing the ball in the direction in which the muzzle is pointing. There certainly are forces acting on the ball, but there are no major forces pushing the ball in the same direction that it is moving after it leaves the muzzle. If the ball happened to be in a vacuum, such as far out in space and away from any source of gravity, it would move along for many years in a straight line at the velocity it had just as it left the muzzle. This is often where many people believe some magical force propels a paintball with an extra push. No! The only time the marker can influence the ball is when it is in contact with the barrel. Why are we so concerned about the forces pushing on the ball. Without a force in the direction of motion nothing can happen. The heart of the statements are embodied in Newton’s Laws of Motion:
Newton’s First Law of Motion : Every body persists in its state of rest or of uniform motion in a straight line unless compelled to change that state by forces impressed upon it.
The key words here are persists and uniform motion. Unless acted upon by some external force (push) an object will not change its speed or direction. We already know from experience that paintballs do all sorts of strange things in the air. They drop; they curve. So they must be acted on by other than forces imparted to it by the marker when in the barrel. However, none of these forces will act to increase the speed of the ball in the direction of motion once it leaves the marker. In other words, the paintball is not going to magically pick up speed once it leaves the marker. I know I keep repeating this, but for some reason this is usually where many people seem to go wrong in their thinking.
Since we know from experience that the ball does not move forever in a straight line, there must be other forces acting on the ball. So how do these other forces work? Well lets first take a look at the Second Law of Motion:
Newton’s Second Law of Motion: The change of motion is proportional to the motive power impressed and is made in the direction of the right [that is, straight] line in which that force is impressed.
Expressed a little differently, the acceleration caused by one or many forces acting on a body is proportional in magnitude to the resultant of the forces, and parallel to it in direction and is inversely proportional to the mass of the body.
The difference between Newton’s words and the second description is that Newton saw the concept in terms of the momentum, mass x velocity (mv). The First Law said that we need a force to make a change in the motion or direction of an object. The Second Law tells us how to calculate what will happen if we impose a force on an object.
The second law results in the formula that is the foundation of classical dynamics:
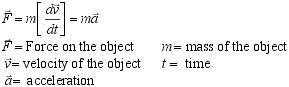
See that middle equality in the equation: For those that have not had calculus yet, the meaning of the d(v)/dt term is the inifinitesmal rate of change of velocity with time. In other words, acceleration is a measure of how fast the velocity changes with time. It is know as the derivative of velocity with respect to time. This is part of what calculus is all about. I know this is confusing for some readers and I apologize. However, to obtain a reasonable answer to our problems we have to use calculus. This rate of change thing is the cornerstone of most advanced calculations in almost every scientific problem. Just bear with me as best you can.
The second curiosity is the little arrow above some of the variables. This means the quantity is a vector quantity and therefore the variable is defined by both a direction and a magnitude. To use this equation, we have to know not only how fast a ball is going, but we have to know its direction as well.
So now lets think about what forces could act on a ball. The most obvious is the force of gravity. We all know about this one. Another important force is the drag force. This is the air resistance that a ball experiences while in flight. You all know about this one too. It is the same force that pushes your hand back if you put your arm out the window of a moving car. These are usually the dominant, easily noticed forces that will affect the motion of the ball. However, there are several more forces that can affect the trajectory, or flight path, of a paintball. They are all based on the aerodynamics of the paintball (the interaction of the air with the paintball). Two of these forces come into play if the ball is spinning. One is called the Magnus effect, and the other is the centrifugal or centripetal force. The last force has to do with the aerodynamics of misshapen paintballs. Although we will discuss this force later, it is the one force that we will not model, because it has so many special cases it is too complicated to deal with easily. Lets write down then the forces that we can expect will have the greatest effect on the path of a paintball in air:

We are going to review each of these forces as they apply to our paintball trajectory problem. For those without a mathematical bone in your body, the important thing to take away with you from the discussion is what variables influence the trajectory of the ball, and by how much.
Fg- The Force Due to Gravity We all know about this force. For our purposes, it is constant and will not change during the ball flight. The equation describing the gravitational force on an object due to the acceleration caused by gravity is given by:

where g is the gravitational acceleration and m is the sample mass. For those of us who have taken some kind of physics course, we have all seen the calculation for an object with a certain initial velocity set in motion at a particular angle. Please refer to any advanced physics book to see a detailed explanation of what is presented below. The calculation proceeds like this:
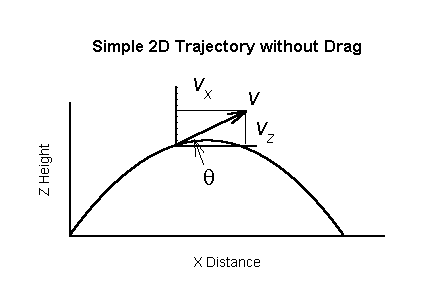
From the picture above, Newton’s second Law gives us:


In this simple case, the variables can be separated and each side integrated (a calculus operation) with the initial condition that for t = 0, v = vo:

where v0 is ball initial velocity. Since the ball is moving in two dimensions there are two equations to describe its motion in both the z and x directions:
 ;

Velocity is defined as the rate of change of distance a body will undergo. This is written as:

If we substitute this into the two previous equations, we can again integrate them with the initial condition that at t = 0, x = 0 to obtain:
 ;

Now in the horizontal x direction there is no acceleration, so:

The problem is what is v0x. From the diagram and a bit of trigonometry:

Substituting this into the equation for x:

In a similar manner:

and:

Eliminating t between the two equations gives us the final solution for the trajectory:
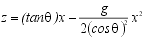
This is the equation of a parabola and from this you can find that if the ball is fired at a 45 degree angle from the ground, the horizontal distance will be a maximum. The magnitude of the velocity at any point on the curve can be found from :

The results of a calculation for a 45 degree trajectory are shown below:
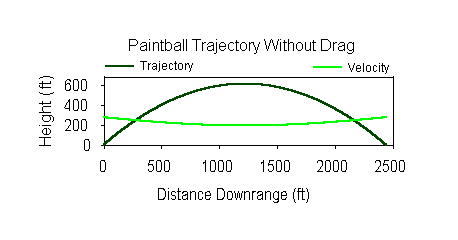
Note that velocity is not constant even in this case, but changes due to the pull of gravity on the ball. The problem is that this parabolic equation does not express the real trajectory of a particle. It would on the moon or other airless planet, but doesn’t work on earth because of air resistance.
FD - The Drag Force The next force we consider is the air resistance the ball encounters. Unlike the gravitation force this one is complicated. (All the other forces that act on a ball are complicated.) Lets think about what affects the air resistance on an object. By going back to our experiment of putting your hand outside of the car, we can get a general idea of what is important. If the speed of the car increases, you will feel a lot more resistance on your hand. Therefore, velocity is important to drag. Note also that the direction of the resistance or drag is opposite and coincident with the direction of the cars speed.
Next, notice that whether you position your hand with the palm to the wind or thumb to the wind makes a big difference. Thus, the drag force must have something to do with the amount of surface presented to the wind. This sounds like maybe the area that the object presents to the wind is important.
A little more subtle is the shape of the object. A flat object presented to the wind seems to have more resistance than a round object of the same plane area.
One other factor is important here, but we have to leave our car to test this one. Get into your boat. Placing your hand in the water when the boat is going the same speed as the car, the drag increases dramatically, no matter how we position our hand. So some property of the fluid (air or water) is important. This could be density or even the viscosity. Well that seems about it.
Okay, so what is the relationship between the drag force and some of the variables we have noted. There have been many experiments on this, and it is a very complicated subject. For a projectile or particle, the formula is usually given as:

p(Greek rho) is the density of air, A is the shadow area. The latter is the two dimensional area of the object, which for a sphere is the same as the area of circle, pi*d2/4.The velocity of the projectile is “v”. The square relationship with velocity means that a little change in velocity can have a large affect on the drag force. However, not all objects exhibit a square dependency with velocity. From what I can surmise from my short exposure to this stuff, the form is based on calculations by Stokes many years ago. He was one of the first to develop a comprehensive theory of particle motion in fluids (you may have heard of the Stokes-Navier equations) that did a fairly good job of predicting reality (dragwise). CD is the drag coefficient. It is a measure of how well an object can penetrate the wind. Thus, it takes into account many factors, such as the shape and smoothness of the object. The higher the value of CD, the more drag the object will have. For many objects such as balls, the drag coefficient is approximately 0.5. The problem is that CD is rarely a constant, and often itself varies with velocity in a complex way. The only recourse to obtaining decent drag coefficients is to measure them. Now you understand the need for wind tunnels.
 Reading
the scientific and non scientific literature on the behavior of balls and
spheres in air is fascinating. There have been quite a few studies on the
aerodynamics of golf balls, tennis balls, baseballs and cricket balls. The
reference section shows just a few of the more critical and understandable
articles that I used in preparing this work. The graph at the left, based on
several papers, is taken from the review article by Mehta [Ref: :Mehta]. The
interest for us is how the curves shift with different balls. First, we have to
back up just a bit and explain the x axis. Re is the Reynolds number; it’s value
is derived from the equation:

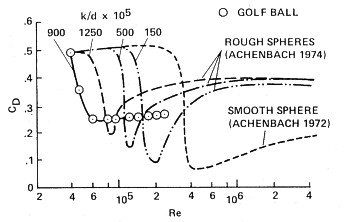
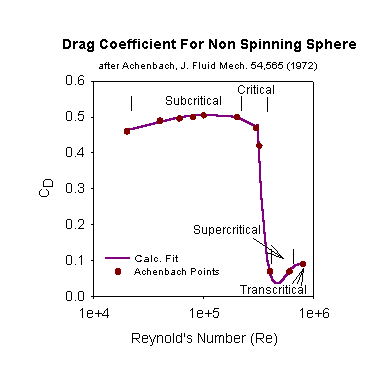
where the only new variable we need to define are d the diameter, and n (Greek nu) is the viscosity. Why is the Reynolds number used here? It is not possible to test every object such as spheres at every size and every speed. The Reynolds number provides a way around this. It is essentially a scaling factor that allows data taken for an object tested under one set of conditions to be applied to other objects of similar construction and shape, but different size and different speeds. For our purposes, just keep remembering that the Reynolds number is proportional to velocity. The data in the graph compares the drag coefficients calculated from wind tunnel data for several different types of balls. Note the dramatic change in the data as the roughness of the sphere changes. However, not only do the drag coefficient curves shift to lower Reynold numbers with rougher surfaces, but notice that there are extreme changes in each curve. At certain speeds, there is a sharp decrease in the dragginess of air on the ball. Golf balls have quite low drag at very high velocity. This is deliberate, and a consequence of the dimples that you see over the surface of the ball. The very low drag means that the ball will go further. The fact that the whole curve shifts to lower Reynolds number means that the speed at which the drag passes into the low drag region is also reduced. The reason for all this behavior has to do with the change from a smooth air flow around a ball to turbulent flow as the speed increases. This turbulent airflow reduces the drag on the ball. Similar curves our found for other sports balls.
 Lets take a closer look at one of the curves; the smooth sphere data by
Achenbach is of particular interest to us. The adjacent graph shows just this
data and defines some of the terms used to describe the Reynolds number regions.
At the critical Reynold number, the drag on the sphere suddenly drops by nearly
a factor of five. Referring back to the drag equation, this means that a ball
above the critical region will have reduced drag and fly further. Of course,
once the velocity drops below the critical Reynolds number, as we will see it
must, then the ball will slow down very rapidly, appearing to drop very fast
(relative to the horizontal distance traveled).
So where does a paintball fit into this scheme. The Reynolds number of a typical paintball with a velocity of 280 ft/sec is around 9.4 x 10⁴. From the curve, we can see that this clearly falls into the subcritical region. As far as drag force is concerned (and perfectly spherical paintballs), there is no free lunch for well formed paintballs.
FL - The Force due to the Magnus Effect This force is often neglected in simple calculations of trajectories, but it is an important component for a spinning projectile. It is also known as the Robbins effect. A rapidly spinning ball develops another force at right angles to the spin axis. This is often called the “lift force”, but it may not always lift the ball. The force developed by the Magnus Effect is very important in many sports.[Ref: Mehta] We all know about the spin pitchers place on a baseball to cause it to curve from a straight path and confuse the batter. Likewise, spins in tennis or golf balls are also important. Of course, in the latter sport it usually is not considered a good thing. The curve produced in all these cases is due to the Magnus effect. The cause of this effect is the interaction of the spinning ball’s surface with the air around it. The schematic below is an example of the flow lines around a spinning ball.
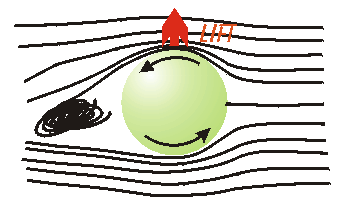
The air is flowing from the right. The flow lines around the top of the ball are closer together than at the bottom of the ball. This means that the air flows faster over the top of the ball than the bottom of the ball. When this type of thing happens, there is a net change in the air pressure between the top and bottom of the ball. As already mentioned, pressure is force per unit area. Hence, the ball experiences an additional force. In the present case, the net force would be upward. If the spin were reversed as in the second case, the net force is downward. The actual reason this happens is due to some very complicated things happening between the surface of the ball and a thin air layer adjacent to the surface (the boundary layer).[Ref: Briggs]. On a smooth ball, this very thin layer of gas around the ball is affected by the spinning ball surface and is set in motion. This layer then affects the way the flow lines separate from the surface near the rear of the ball, and this in turn affects the entire pressure distribution on the ball. Well, to be honest, I can’t say that I understand the details myself. However, we all have experience at seeing this effect in action, whether watching a baseball or paintball curve. The Magnus effect is not the same thing that causes a ball to bounce off due to English when it contacts another object. We are discussing a purely aerodynamic force. Unlike the experience we were able to draw on for drag, the Magnus effect is harder to characterize. Through experiments and apparently analogy, it is often characterized in a similar fashion to the drag force:
If the ball has bottom spin, that is it spins counterclockwise, then the force is a lifting force which is what the “L” stands for. However, the force can be in any direction depending on the tilt of the spin axis. That is why we have sliders and curve pitches in baseball.
 As with
the drag force, the Magnus force lift coefficient must be determined
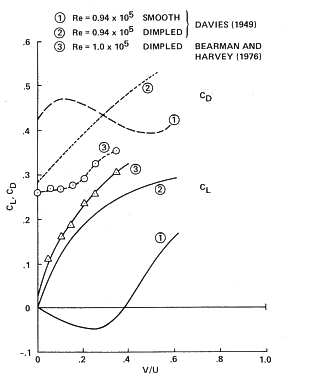
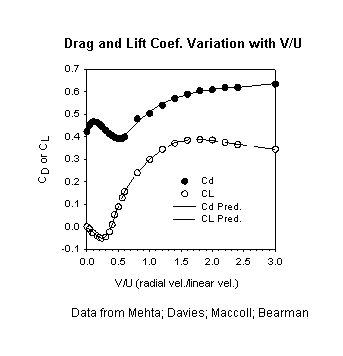
experimentally. The adjacent Figure shows data from several workers.[Mehta] The
work by Davies is often cited and used for a smooth spinning ball. The data here
is plotted differently than in the previous figure for the drag force. In this
case, the parameter V/U is used which is the ratio of the surface speed
of the ball to the linear (forward) velocity. The surface speed is given by the
formula V = d x rpm/60. Note that both the drag force and the Magnus
force have the same equation form, but the lift coefficient, CL, is
quite a bit lower than the drag force. Therefore, Magnus Effect contribution to
the total force acting on the sphere or paintball is quite a bit less. At low V/U
values, note that FL will be negative. This is called the
antiMagnus effect, and has only been observed for smooth spinning spheres. You
should remember that this antiMagnus effect region is where paintballs most
likely get their curve from.
FC - The Centrifugal Force This force, developed by all rotating objects is very important for the stability of missiles, bullets, or artillery shells. However, a paintball is a centrosymmetric object. I am still working on what this force can mean to a paintball. It certainly has been ignored in almost all sports ball calculations. My best guess at this time is that this force would only come into play if the spin axis direction of the paintball changes during flight. The change in axis would be resisted by the spinning motion. This force would also slightly elongate the shape of the paintball perpendicular to the spin direction. How much this would distort it, I have not yet worked out. It certainly isn’t going to turn the paintball into a thin disk. The distortion will affect the drag and lift coefficients, but more on this later. For the time being; we will ignore this force.
Other Forces? There is at least one other aerodynamic force that has been observed with other balls that have prominent seams on their surface such as cricket balls or tennis balls. In these cases, depending on the angle that the seam makes with the air flow, the boundary layer flow around the ball can change more quickly on one side of the ball than the other. The result is similar to what happens in the Magnus effect. Take a look at this link and the links within it for a nice description and images of this force. A differential pressure occurs and the ball experiences a force in the direction of low pressure side. This force is a real wild card. A perfectly round paintball with no seam will not experience this effect. However, reality is quite different. Most paintballs do show seams and, in addition, are somewhat ovoid. I cannot model this force. There is data for baseballs and cricket balls, but these are not really comparable to paintballs. I have not found any reference that measures the force on slightly misshapen smooth spheres or balls with a single seam. In the case of cricket and baseballs the impact of this force on the trajectory is nearly the same as the Magnus Force. This force is also complicated because it will also have to be as a function of spin and depends critically on orientation of the seam or imperfections on the ball. For now, all I can do is make you aware of the problem and ignore this effect.
The Equations of Motion for a Paintball and the Trajectory Calculation (How do we figure all this stuff out?) Having discussed all the forces that might effect the flight of paintball we are now in a position to write down the equations of motion. We actually proceed in a manner similar to the one shown for the two dimensional calculation of the force of gravity on an object outlined above. Because we will be taking into account the effect of spin, which can cause a ball to curve to the side, the calculation becomes a 3-dimensional problem. The coordinate system and forces involved are shown in the drawing below.
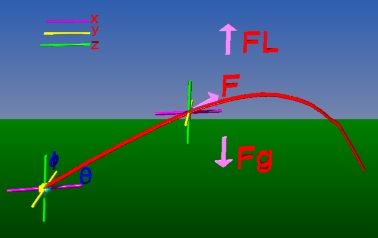
In addition, to the three axis, there are three angles (θ theta,φ phi,υ eta) that describe the position of the force vectors; θ (theta) is the angle in the direction the ball is traveling measured relative to the xy plane; φ (phi) is the angle the spin axis makes with the xy plane and measured in the yz plane from the positive z axis, and υ (eta) is the angle the spin axis makes relative to the xy plane and measured in the xz plane. This latter angle is the case where the spin axis would be pointing forward or behind the yz plane measured through the center of the ball. Just how this angle affects the trajectory of the ball is not clear. Obviously, it will bring in Magnus force components, FL, in all three directions. However, it is not clear if it would be that simple since we are dealing with an aerodynamic effect. One thing does seem to be clear. Whatever the effect, the balls curvature will not be greater than that experienced when φ eta is 90 degrees, in other words, when the spin axis is only restricted to the yz plane. Therefore, we will neglect the φ eta angle .
We can now write down the force equations:



FL is more complicated to write down than the previous discussion would imply. Since it is the interaction of a spin and linear system and we need to consider both, the vector cross product is involved. Discussion of a vector cross product is beyond this document. Refer to an advanced physics book or advanced mathematics book on vector multiplication to understand it. The vector description of the entire system is :
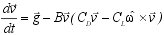
where is the spin vector. The unit spin vector is given by:
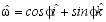
is the angle that the paintball’s spin axis makes with the positive z axis. We then substitute in the definitions of the various forces, and also substitute the following definitions:


The resulting dynamics equations are:

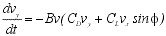
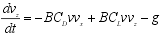
where:
 and

These are the equations of motion that must be solved. Notice that each equation has more than one velocity component. This means that these three equations are coupled differential equations. Calculating any one of the equations modifies another. In some cases, coupled differential equations can be solved exactly as we did in the simple case considering only the force of gravity. No exact solution currently exists for solving this particular set of equations. To find the trajectory, we have to use numerical integration methods. With modern computers, there are quite a few ways to do this. The basic operation is to calculate the acceleration change in an extremely small time interval, calculate the velocity over this interval, and then calculate the x, y, and z changes. These new values are then used to predict the next interval and so on. In truth, the procedure is somewhat more complicated in order to get a good estimate of the changes in a small interval, but the essentials are as described.
Before we go on to the results of the calculations lets take an overall look at what these equations tell us. They should tally with our everyday experiences. To begin, remember from the first drawing above that x is the down range distance along the long axis of the barrel, y is the lateral or side to side distance from the barrel axis, and z is the vertical distance from the barrel axis. The left sides of the equations tell us that what we are calculating is how fast the velocity changes as time goes on. That is, each equation tells us how the ball accelerates or decelerates in the x, y, and z directions. Second, notice that the first two equations for x, and y; do not depend on acceleration due to gravity. This is because gravity only operates in the vertical direction. Third, all three equations depend on the mass (in the constant B), but the mass only effects the lift and drag parts of the equation. This makes sense. In a vacuum, where there is no air drag, a lead ball and a feather dropped at the same time, fall at the same rate. They both touch the bottom at the same time. In addition, we see the mass is inversely proportional to both the drag and lift. The higher the mass, the lower will be the rate of change of the velocity in all three equations. This means that the ball stays at higher speeds longer. So a very heavy ball will not slow down as fast as a very light ball. Think about what happens when you throw a Nerf ball compared to, say, a baseball of the same size? If you throw each with roughly the same speed, the Nerf ball doesn’t go nearly as far. That is just what the equations say. For the lift (Magnus) force, the inverse relation with mass means that less lift will be created as the weight of the ball increases. Thus, if we fire a paintball without any fill in it and it has bottom spin (the top of the ball moves toward the barrel) we would expect the ball would drop slower compared to a filled paintball because its mass is much less. Of course, the problem is that drag and lift have different signs in the vertical z direction, which means that these forces tend to cancel one another to some extent. A lighter spinning ball will drop slower, but there is more drag on it which tends to make it drop faster.
RESULTS (Ack! Too much theory; just give me the facts!) We have already showed the results for the idealized paintball shot on an airless Earth. So we will directly launch into the more realistic results for the world we live on. There are a couple of things that need to be mentioned first. All the calculations are presumed to be in an environment at 750 mm pressure (slightly below 1 atm) and a temperature of 25 C. As we saw in the previous section, air density and air viscosity are important parameters in calculating drag and lift coefficients. Both of these variables depend on temperature and pressure. Most of the calculations start with an initial velocity of 280 ft/s. Different fields have different velocities, but around where I live this is about the average allowed speed. You can develop your own curves from the trajectory calculator. The paintball diameter is taken as 0.679 inches. This is based on the data in the paintball analysis page.
Trajectory information on non spinning paintballs Maximum Distance Trajectory The first case we will examine is one that everyone wonders about, but is not practical in the sport of paintball.
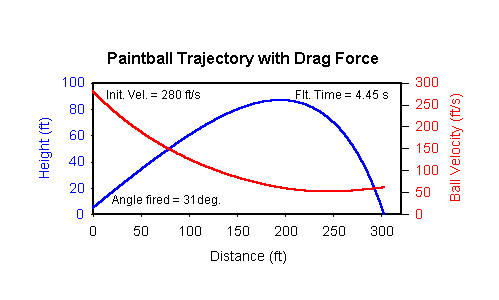
The figure above shows the trajectory and velocity change for a paintball fired at an angle of 31 degrees with a speed of 280 ft/s. Why such a strange angle? Well, from trial and error I determined that this is the angle (to the nearest degree) that gives the maximum distance. Lets take a look at the trajectory first. According to the calculations, the maximum distance is 302.6 ft and the ball rises to around 86 ft. The ball follows an almost linear path initially, then drops rapidly. This trajectory is typical of non powered flying objects. Many of you have heard that the maximum angle is 45, so how did I come up with 31. Drag! This goes back to what I mentioned about when most people stop learning physics. Without considering drag the trajectory can be predicted using algebra and a few equations. Once we enter the real world and allow for the drag force, the entire problem becomes more complicated. Calculus is needed to provide accurate calculations. If you want a real simple but powerful image of this trajectory, just reach into your everyday experience. A stream of water from a garden hose will show exactly the same kind of trajectory.
Now in the Figure look at the change in velocity as a function of distance. The most striking event is the drop in speed. It is especially rapid just after the ball leaves the barrel. By the time the ball has gone 100 ft it’s speed is one half of the initial speed. Moreover, by the time the ball could hit an object on the ground some 300 ft away from the marker, the velocity is down to 60 ft/s. That is roughly half the speed a pitcher in baseball would throw a ball. (However, a baseball carries a lot more momentum.) Also remember, the chance of the ball breaking at this velocity is going to be lower. This is why this trajectory is not practical for the sport of paintball. Personally, I knew paintballs dropped in velocity, but I was surprised the velocity fall off was this large. Notice that the ball speed rises near the end of the trajectory. If you look at the trajectory, you can understand why it speeds up again. The ball is now dropping and no longer “fighting” gravity.
The “Useful” Trajectories We now need to take a minute to think about what we really want to investigate in this section. If you haven’t already done so, think about the distances where you face most of your opponents on a typical field arrangement. I know each field is different, but from my experience on both indoor and outdoor fields, in the early part of a game the opponents are in the range 50 to 125 ft apart. We all try “long balling” once in a while, maybe out to 175 to 200 ft, but as we will see, in truth the chances of hitting something and breaking a ball at that range are not very high. (See the section on paintballs.) On the other hand, at less than 50 ft the inaccuracies that can affect the ball drop off to the point they don’t matter much, unless they are extreme. Next time you go to a field, keep this in mind and see if I am right. First, measure off some distances around your home and place a friend or family member at the points to get a feel for the ranges.
So from our practical perspective we are only concerned with the distances between 50 and at the most 175 feet. What do these trajectories look like? Here they are:
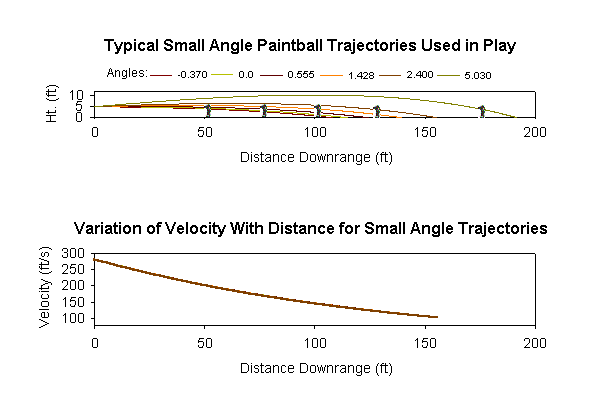
The vertical axis in the top graph has been deliberately squeezed so that the height and distance axes have the same relative scale. This makes for a poor looking graph but does gives a better idea of the real path you would see. All these trajectories start at the same point, from 5 ft off the ground. This is roughly the height where the marker would be at the shoulder of a 6 ft person. The small “figures” on the above graph shows where a paintball would hit them. They are placed so that they would be hit at a height of 4 ft. This is just about the lower chest level on a 6 ft person.
The lower figure shows the velocity curves. They look like one continuous curve, but it is all the velocity curves superimposed on each other. There are slight differences in the velocities for each angle, but they are too small to be noticed.
Some of you may be surprised that these angles are very small. The largest is only slightly more than 5 degrees. If you can’t believe that, just watch someone else playing. The marker indeed does not rise very high as the calculation suggests. Since we will be using these trajectories for the balance of our discussion, the Table below gives you some detail about them.
| Small Angle Changes in Velocity, Distance and Time Relationships | ||||||
| Parameters to reach 4 ft height | Maximum range parameters | |||||
| Angle | Dist. | Vel. At Dist. | Time | Dist. | Final Vel. | Time |
| deg. | ft | ft/s | sec | ft | ft/s | sec. |
| -0.370 | 50 | 201.4 | 0.212 | 108.6 | 137.9 | 0.575 |
| 0.0 | 57.7 | 191. | 0.25 | 115.0 | 132.4 | 0.615 |
| 0.555 | 75 | 170.9 | 0.347 | 124.7 | 124.5 | 0.691 |
| 1.428 | 100 | 145.4 | 0.506 | 140.0 | 113.2 | 0.821 |
| 2.400 | 125 | 128.1 | 0.651 | 155.8 | 103.9 | 0.951 |
| 5.030 | 175 | 91.0 | 1.176 | 192.0 | 83.0 | 1.317 |
| Initial paintball speed = 280 ft/s; starting height = 5 ft; |
The first distance column is set at nice neat values except for the 0 deg case; this is deliberate. By trial and error, the angles were set to achieve a height of 4 +/- .05 ft at these distances. The negative angle at the 50 ft distance comes about because of the close distance between gun and target, and the fact that the marker is fired from a 5 ft height at a 4 ft high target point. This table contains some interesting information that you may not have thought about. The trajectories, although curved, look approximately linear for much of the range. It reinforces the point about the large drop in ball speed at various distances. Also, note the times, especially for the fixed height set of data. It takes a long time to reach 100 ft. If the person is running, you better have a long lead. For example, for someone running across your field of view at 6 miles/hour and a hundred feet away, you would have to lead him by ~4.5 ft to hit him. That is roughly 3/4 of his body length.
In addition, the long travel times for a paintball to reach, say 100 ft (0.5 seconds), also can explain why sometimes players think that they are delibrately being shot after they called themselves out. In a tense game, even a half second can seem like a long time. Even if an opponent’s mind and body registered your call within 0.1 seconds, balls could still be coming your way for 0.6 seconds after you yell out. Now I am not trying to justify overshooting here. There are definitely times when some social midget does it delibrately. However, realizing that there can be a long natural lag time should make you a little more tolerant of other players motives.
Effect of Paintball Speed Variation on Trajectory So now we have established some baselines trajectories that we can use to look at other effects. One of these is the question of what happens if the ball speed isn’t 280 ft/s. I am sure all of us have noticed that a chronograph never shows the same velocity for your marker all the time. There are two reasons for this. One is the accuracy of the chronograph itself. However, compared to variations due to your marker condition, I believe this is a fairly small problem.
What can affect the markers ability to maintain a constant ball speed?. Just about everything you can imagine. The size and shape of the paintball will affect the muzzle velocity because gas may leak around the ball causing a drop in velocity. You don’t really believe all paintballs are perfectly round do you? Any scuffing on the ball or in the barrel can cause increased drag. Especially with some markers, the presence of liquid in the holding chambers will have a big impact on the velocity.
Another big factor is repetitive shooting, and where the marker is stored between games. Gas expansion, especially when the gas is carbon dioxide, is an endothermic process, that is, it takes heat to expand a gas. This is a result of gases being what we call non ideal. (In other words, an ideal gas wouldn’t do this.) When a gas expands it takes heat from its surroundings. The result of any rapid gas expansion is that the gas absorbs heat from its surroundings causing local cooling. This effect is known as the Joule-Thompson effect; It is the same principle used in your refrigerator or freezer. As you fire your gun, the chambers and lines that store and move the gas cool down. This cooling affects the pressure. How? Well, there is a famous Law known as the Gas Law which is written PV=nRT. P is the pressure of the gas, V is the volume of gas in the chamber, n is the amount of gas, R is a constant and T is the temperature. If the volume of the chamber doesn’t vary and about the same amount of gas goes into the chamber each time (it may not), then we can use the Gas Law to monitor the changes caused by temperature by equating the two states of the gas before and after cooling. This gives us, P0/T0 = PL/TL, where the subscript 0 is the pressure at the start of firing and L is at some later time. We can rearrange this to PL=P0(T0/TL). It is the temperature ratio that really interests us. Now T is not in Fahrenheit or Centigrade temperature units, but is measured in Kelvins. At 25 C = 77 F that is 298.15 K. If the temperature of the chamber drops to say 10 C = 50 F, then the temperature ratio is (283/298) or 0 .95. This means that there will be about a 5% drop in temperature, and PL will also be 5% less. If this pressure drop is directly proportional to a corresponding drop in velocity, we can expect our starting velocity of 280 ft/s to drop to 266 ft/s. That is quite a change! Also, if the marker is in the sun very long, we may see the pressure rise with a corresponding increase in velocity. I am sure that anyone who has left their marker in the hot sun (not a good idea for several other reasons) has experienced this when they went to chrono their marker for a game.
Despite the lengthy discussion about the Gas Law, the real pressure drop and corresponding change in ball velocity will be much worse. Considered as only a gas phase problem, the Ideal Gas Law seems like a reasonable choice. However, we really are not discussing just the gas phase. The tank is filled with liquid CO2. Second, CO2 is not an ideal gas, especially at the tank pressures used. A better solution to the problem can be found by examining the observed pressure versus temperature data for the CO2 vapor/liquid phase diagram. In this case, the effect of temperature is even more dramatic. I will not show the detailed PT phase diagram. However, a 5 deg. F change in temperature from 77 deg. to 72 deg. F will change the pressure by 6%. Again, assuming mass transfer of the gas will remain the same, the velocity will drop from 280 ft/s to 262 ft/s. A drop in temperature from 77 to 50 degrees as used in the Ideal Gas calculation will produce a 30 % drop in pressure, or a drop in ball velocity from 280 ft/s to 196 ft/s. Even this may be optimistic. If the temperature drop also produces a reduced mass flow into the firing chamber then the pressure will be even lower.
So what happens to the trajectory when we have a variation in speed. By simply holding the gun angle constant and varying our initial ball velocity, we can find out. The following figure shows what happens:
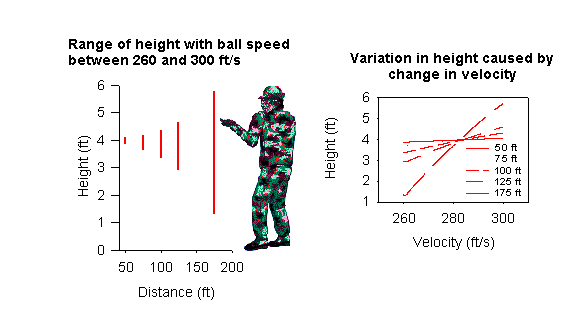
Each vertical line in the left figure represents the total vertical range of variation that would be observed if the speed varied between 260 to 300 ft/s at the distance marked on the the horizonatal axis. The longer the distance, the more affected is the accuracy of the ball. Again we are centering are target location at four feet high. Looking at the envelope of variation, we can see that it is nonlinear. The length of the vertical lines do not change linearly with distance. The right figure gives us another way to examine the same data. Here we are plotting for a fixed gun angle the height of the ball as a function of the initial ball speed. The greater the slope of a line, the greater the impact a small change in speed has on the final height reached. Now this isn’t new. We all intuitively know this, but now we can see how such variations arise, and the type of control we needon our equipment.Taking the slope of the lines near the 280 ft/s line provides us with an idea of what kind of change we will experience per change in 1 ft/s. The table below tabulates the data:
| Effect that a 1 foot per second velocity changes has on target strike position at various distances. | |||||
| Velocity ft/s | 50 | 75 | 100 | 125 | 175 |
| Change in target point (inches per 1 ft/s change) | 0.06 | 0.14 | 0.29 | 0.52 | 1.33 |
So at a target 125 feet away, a 1 foot per second difference in velocity causes roughly a ½ inch variation in vertical. But that is from less than a 0.5% change in velocity at 280 ft/s. At 5% or roughly +/-14 ft/s the change is 10.5”. Admittedly, this is not a very big change, but it will make a difference if your target is sideways to you.
The Effect of Spin on the Trajectory of Paintballs. We have already discussed that paintballs will curve if they are spinning. This is due to the Magnus effect. Even our intuition tells us this must be happening. Anyone who has played paintball has seen the balls curve. Sometimes, to our consternation, it’s a very dramatic curve. Have you ever seen a ball drop and then come back up. I haven’t, but my son was shot out of a game recently by one. Very frustrating, but entirely possible! Even more so now that a barrel designed to force a spin is in production (see below).
Spin…How Much? Before I show the data it would be useful to have some idea of how much spin a paintball can have. This is not a simple question. It depends on what happens inside the barrel, and I said earlier I was going to avoid getting into that aspect of paintball physics. Well, I lied a little bit. We need to apply some reasonable constraints on the velocity that the ball can achieve. Therefore, we want to have some rough idea of the possible velocities the paintball might achieve.
First, some useful (useless?) facts: The ball is being accelerated from 0 to 280 ft/s along a distance of roughly 1 ft. We can calculate that the acceleration of the ball is roughly 39,200ft/s2. That is over 1200 g’s! The time to traverse the barrel is roughly 0.007 s.
Now as far as spin is concerned lets consider the most extreme case: The ball is frictionless on all barrel surfaces except for a line that has the texture of sandpaper running down the length of the bottom ID of the barrel. That line will produce an awesome friction and a net rotation of the ball. Its just like rolling a ball down an inclined plane. Assume there is no sliding to reduce the spin rate, that is linear motion is directly converted to spin on the ball . A 0.679” diameter ball has a circumference of 2.13”. Let’s assume that the ball achieves its maximum speed of 280 ft/s almost instantaneously. The ball will then make one revolution in (2.13 in/12 ft/in)*(1/280 ft/s), or it will make 1574.8 rev/s; this is 94488 rpm. That is quite a spin rate! Of course, it is very doubtful that a ball would ever be able to achieve this kind of speed for several reasons. First, in a real barrel the ball would slide as well as roll down the barrel. Second, the ball is not instantly accelerated to the final velocity. These two points are so important that they put the maximum spin rate estimate well beyond reach of any kind of normal paintball marker.
Unfortunately, it is not so easy to predict what is realistic. From my own field experience, watching the antics of my wayward paintballs and playing with variable spin rates in the dynamics equations, I believe that most of the paintballs that go wild, probably don’t get much over 10,000 rpm. For most of the results given here, I will therefore restrict the spin to values less than this spin rate. However, because of some attempts by others to deliberately apply spin to paintballs, I will address high spin rates at the end of the spin section.
Changes in Trajectories with Spin
Present.
So lets take a look at one of our typical trajectories with spin present on the
ball: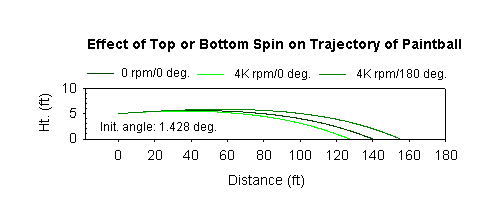
In the figure above we are using an angle that without spin would have a trajectory that would hit a 4 ft height at 100 ft. We apply either back spin (spin angle of 0 degrees) or top spin (spin angle of 180 degrees). According to the direction of the ball in the figure above, backspin is a counterclockwise spin on the ball. As I mentioned before, in the initial speed range of most paintballs the balls will exhibit an antiMagnus effect. Our intuition tells us that back spin should cause a ball to rise because the air is “sped” up over the top of the ball compared to the bottom by the spin. However, for smooth balls at low spin rates, the opposite will occur. So in the present case, the top spin ball produces a lifting force and the ball goes farther. Not only that; look carefully at the trajectory of the top spin ball. Notice that it is flatter for a longer range than the other two cases. We shall return to this flatter trajectory and its ramifications later in the high spin rate case.
Gee, maybe those people who claim that their paintballs travels with a flatter trajectory could be correct. Unfortunately, its because their barrel is probably damaged or dirty, so that its producing top spin.
Lateral or Side Spin Effect on
Trajectories
The next problem is side spin. In the previous case, we examined paintballs with
either pure top spin or pure back spin. The spin axis was oriented either at 0
or 180. Now we will consider pure side spin. The paintball’s
spin axis is oriented at -90 or +90 degrees. (Note: These spin angles are a
little confusing. From our coordinate system setup, the angle we input into the
equations is actually the direction of the “lift” force rather than
the spin axis. The spin axis is at 90 to the lift force vector.)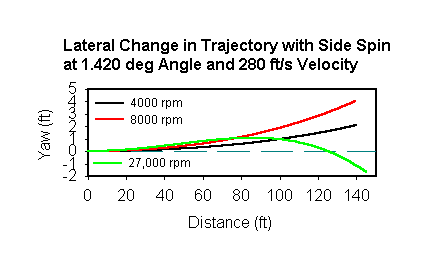
The spin axis in this figure is set to 90 deg. The figure represents the trajectories looking from directly above. We are only interested in the side motion in this case. There are a several interesting points about this graph. Although the ball curves continuously, the curve is most prominent in the later part of the trajectory. Remember that the lift coefficient which gives rise to the yaw, first becomes more negative as V/U (spin velocity/linear velocity) increases. Our calculations assume that the spin velocity does not change at all, but we already have seen that the linear velocity drops very rapidly from the initial velocity of 280 ft/s. Hence, the V/U value begins to change rapidly with distance, and has a progressively greater effect on the curve. Second, even at the low spin rate of 4000, there is a quite large deviation from a straight line. The shift is over 1 ft at the 100 ft distance mark. This would shift the ball from a dead center chest hit to a right arm hit. At 8000 rpm, the ball would likely miss everyone, but an overweight player. The most curious trajectory is obviously the very high spin case of 27,000 rpm. Here the ball actually curves out and then comes back in and crosses to the opposite side of the center line. This behavior is very similar to a curve ball in baseball. What’s going on here? Well, lets take a look at the way the lift coefficient changes with distance in this particular case:
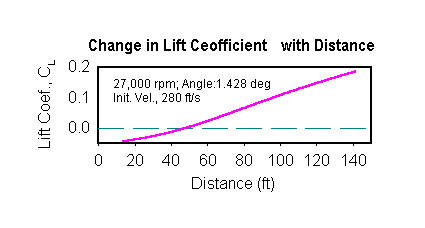
Remember again that the lift coefficient is controlled by the ratio of the spin velocity to the linear (forward) velocity V/U. We see that CL is first negative so we have an antiMagnus effect which forces the ball to the left. However, very soon the ball’s speed drops; this forces the spin ratio to increase. From the Davies/Maccoll data, we showed in the Theory Section, which was used in the calculations found in the Calculations Section, at high V/U we shift to a pure Magnus effect, and the ball experiences a rapid and large force to the right.
The Complete Effect of Spin on
Trajectory
We have looked at the effect of spin only in the vertical and horizontal
directions. What about other spin angles? By varying the spin velocity and the
initial spin angle the “hit” or target region that a paintball with
random spin effects will exhibit can be determined. The following Figure shows
the data: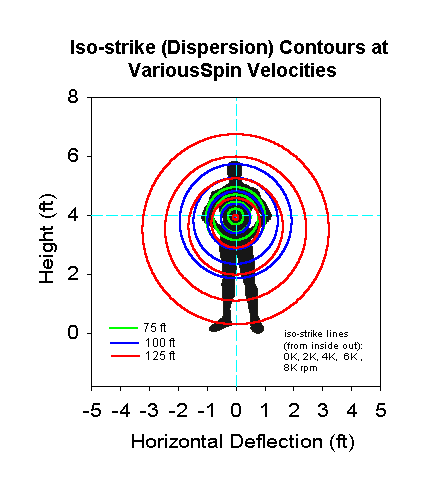
There are three sets of data at ranges of 75, 100 and 125 ft distance. Again, we used the angles so that if there were no spin the ball would pass through the 4 ft height point. The starting velocity was 280 ft/s. Each range has five lines associated with it. These are iso-spin lines, or iso-strike lines. Each represents where a paintball with a given spin rate would pass through at that particular range. Each of the iso-spin lines describes a circle. A paintball with any spin rate lower than that at which the line was calculated would fall within that circle. Another way to look at these circles would be as defining the accuracy range of spinning paintballs. Look at the smallest set of circles. For a distance of 75 ft, even 8000 rpm does not produce enough variation to miss a frontal target. Of course, if the figure was sideways, there would be a greater chance of missing. At 125 ft, the situation is very different. The chance of hitting a target even with a low speed of 6000 rpm is going to be much lower. As a rough measure of the probability, just look at the area occupied by the figure and the area encompassed by the 6000 rpm iso-spin line. Roughly about 2/3 of the area is outside the figure. This suggests that if the ball were randomly spinning with any spin up to 6000 rpm at random angles from the gun, the probability of hitting a person 125 ft away is about 33%. Definitely not a good recommendation for long balling.
From another perspective, at 2000 rpm, the chance of striking a body part is nearly 100 % at all distances from 75 ft to 125 ft. Even at 4000 rpm, the chances are well above 50%.
Another point to notice is that the accuracy circles shift to a lower position at longer distances. This is due to the effect of gravity. Protect that groin!
The Effect of High Spin Rates on the Trajectories of Paintballs So far we have been discussing relatively slow spin rates that I believe apply to random spin effects we might see with just about any paintball gun. Here, we are going to examine the effect of much higher spin rates on paintball trajectories. This section was prompted by several recent events that have come to my attention:
I have learned that several manufacturers have produced bolts that produce an asymmetric flow of gas in the barrel, which may or may not impart a delibrate spin to the ball.
More recently, a radically new barrel has appeared by Tippmann Pneumatics Inc. This barrel is “S”-curved so that the muzzle is higher than the firing chamber. I also understand that it is oversize. The curve dictates both the direction of the spin, and the magnitude. The oversize barrel is needed so that gas will blow past the ball in an asymmetirc manner causing differential friction and thus promoting a spin. Now despite the seeming revolutionary character of this barrel, I want to emphasize that the concept is by no means new. Robbins,(the Magnus Effect is sometimes called the Robbins Effect) who did some of the early work on spinning balls, used bent musket barrels to show that the curved barrel imparted a spin to the musket ball, causing them to curve. Nevertheless, Tippmann engineers do deserve credit for realizing the potential for the sport of paintball, and for developing the barrel itself. Since this is a relatively new development, only time will tell its worth. What I wish to do is to show that, indeed, this idea is not pure fiction, but in fact can be shown based on the physics developed here. Also, note that in the discussion section, I offer several other ways to impart spin without a special barrel. (Even though I hang my head in shame that when this document was first published on the web in March of 1999, I missed the obvious case that Tippmann has developed.)
Whereas our previous results at relatively small spin rates with back spin kept the paintballs in the anti-Magnus regime, we are going to look beyond that range here. If you go back and look at the curve for the lift coefficient, you will see that at low ratios of the spin velocity to the forward velocity, the lifting force is going to be negative, but at high ratios the value becomes positive. That means that at high spin rates, there is a “lifting” force on a spinning paintball. I also showed in the side spin section that at higher velocities this can lead to some strange side spin motion. The same is true for the vertical component of the trajectory. Here are some examples:
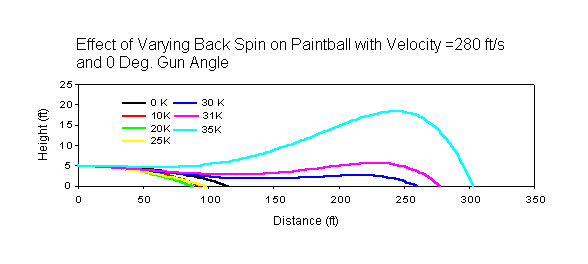
The figure shows a series of trajectories developed from different spin rates. In all cases, the balls have back spin on them. This means that the ball is rotating counterclockwise when viewed from the right side. There are several things to note. At low spin rates, the paintball drops closer to the gun than the non spinning paintball. This is due to the anti-Magnus effect. As the velocity increases, the point at which the ball hits the ground begins to increase. Not only that, but the vertical component of the trajectory begins to take on rather strange shapes. No longer do the trajectories have an initial long, nearly flat portion and a rapid drop off. The trajectories become very complex with a distinct dip in the middle. The paintballs begin to take a real roller coaster ride. At even higher spin rates the ball actually rise up and then drop. Pay particular attention to the impressive distances the ball can now attain. Given the right spin, the trajectories are quite flat with little variation in vertical height, and can double the distance.
Another point about the curves is the big change in the shape of the trajectory between 25,000 and 30,000 rpm. This is due to the fact that in this range we “break through” the anti-Magnus effect region (negative lift force) into the the Magnus effect region (positive lift force) very quickly. If you go back again and look at the lift coefficient diagram in the Calculations Section, you will see that there is a rapid increase in the lift coefficient from negative to large positive values. It is the ball entering this positive region very quickly at high spin rates that causes the sudden change in trajectory shape.
The value at 31,000 rpm is particularly interesting and is shown for a specific reason. This spin value turns out to be where the trajectory changes the least in vertical height, that is, has the flatest trajectory and still has excellent extended range. If such a trajectory could be achieved, then it would not be necessary to angle the barrel up to hit a far away target. One of the frustrating elements of “long balling” is the number of shots it takes to find the right angle to raise the barrel and not drop paintballs too short or too long. Even then, at long distances, I often cannot see if I really am dropping the ball where I want it. Worse, the element of surprise is certainly gone when the opponent sees balls dropping around him. There is a downside to these wonderful long trajectories. By the time the ball hits the ground its speed has dropped to 45 ft/s. Even when it finally begins to drop to the ground and is just below 4 ft height, its velocity at ~250 ft is 52 ft/s. I have doubts whether a ball hitting a soft object at that speed will break very often.
In most of the previous discussion of spin, I went out of my way to indicate that spin is not your friend. We now see that it can indeed be your friend under the right circumstances. Of course, the spin rates needed to achieve these effects are very high. However, if you look back at the maximum attainable spin rate I calculated, you will notice that the present values are still far below that limit. That is encouraging.
Relevance to Available Data on Paintballs and Equipment Well, I have shown a lot of calculations, but can we put some real world data to the test. Unfortunately, there is very little hard reliable data for comparison. Although I have some reservations about the available data, Ie will try and relate it to the calculations.
For our first case, we will examine the study by TRicKOuT (!?) on testing how “good” some paintballs are over others. Quite a few different paintballs were used for the tests. The test consisted of dropping ten balls of each type from various heights onto concrete and determining at what height they broke. This is a nice straightforward test, and the author is to be commended for the work. However, the published information lacks rigid control. First, how old was the paint? How was it stored? What was the temperature and humidity during the test? Were the balls dropped with the seam toward the ground or the pole? Does it matter? (It might.) What was the criteria for breaking? Did all have to break, or one? In my own just as uncontrolled tests I had quite different results on two paints. Brass Eagle did not break at 6 inches, more like 4 ft. RP Scherer Premium purchased a month before I tried the dropping tests, did not break even at eight feet, while the above study found the balls broke at about 6’ 10”. Of course, the problems could even be different lots of paint in addition to all the aforementioned factors.
Despite the limited data and need for more precise controls, there is some very useful information here. It would appear that most paintballs will break at distances somewhere between 6 feet and 10 feet. What are the speeds associated with these heights? Well the trajectory program won’t allow a zero velocity, but if we make the number very small and use an angle of 0 degrees, we can obtain the speeds that the paintball will reach just as it hits the ground. From 4 ft, 15.8 ft/s; 6 ft, 19.3 ft/s, 8ft, 22.1 ft/s; 10 ft, 24.6 ft/s. So the speeds are not very high. Remember, we calculated that even a maximum trajectory would have a speed of 60 ft/s as it hit the ground. However, a big factor here is the type of surface it is hitting.
The above ball breakage data would appear to conflict with a comment in another study - the “Lapco Barrel Challenge” by Richard Allen on barrels. This study was concerned with trying to answer what is the best barrel. In the document, it was mentioned that some balls were bouncing off a plywood target at 150’. I calculated the speed that the balls should have at this distance and found it to be around 110 ft/s. This is quite a bit different than the ~24 ft/s found in the previous results. The difference between hitting a plywood surface and a concrete floor should be only slight, so it is not clear why the large difference. One possibility is that in this study the balls were hitting the target at a glancing angle rather than perpendicular to the surface as in the drop tests.
The latter study may have one other useful bit of comparison information. The results are difficult to fully interpret for our purposes because some important information is unclear or the test procedures could lead to inaccuracies. For example, the guns were not in a vise, which could introduce a measure of dispersion at the target. We also don’t know high the guns were mounted, and what was the angle of the shots. Although the velocity of each ball for one series of tests was recorded, the velocity was apparantly not recorded for the other two series. It is not clear whether the velocity of each ball for the clocked series was compared to its impact on the target. (It would be interesting to see if there were any correlations.) However, one finding that seems to be true is that if the bore of the barrel was oversize compared to the paintball. (by several thousandths) the balls tended to be more erratic. At distances of 150 ft, the variation was on the order of ~36”. Going back to the last figure for different spins and orientations we see that this is roughly in the range we would expect for random spins around 4K rpm at 125 ft. We can do a little better. A calculation with the velocity information, a starting height of 5 ft and assuming our 4 ft target point, I found the range of variation is from 30” at 2K rpm to 58” at 4K rpm. The consistency with the observed group range is quite good.
This raises an interesting question as to what is the mechanism that gives rise to the inaccuracy when there is a large mismatch between the barrel and paintball. If it was a seam or misshapen ball problem, then why would the variation show up as a function of barrel size. My guess is that we have unbalanced pressure variations in such cases that cause not ball distortion, but spinning.
Explain Why All My Paintballs Don’t Follow the Calculations? Now we get to the fun section. In the prevous section, I examined the major forces that a paintball is subjected to. So why don’t your paintballs act exactly like the calculations? The answer is simple: Reality is more complicated. The calculations are based on nice neat armchair science. Our paintballs were all perfectly spherical; they also were perfectly smooth and perfectly filled. Our marker did cause spin on the ball, but in other respects was a perfect gentleman. Their was no wind, nor temperature variations.
This section is where I criticize the nicely packaged theory I have plodded through. Here the theory hits the real world fan. I will discuss the limitations inherent in the calculations, and genuflect before the complexity of reality.
By the time you finish reading this section, you may be saying why bother to predict the trajectory with so many possible variables that can affect the sport of paintball. However, barring any major changes in the drag and lift coefficients, our calculations will predict the ball’s trajectory. All the real world scenarios I discuss are secondary to the forces that we used to calculate the trajectories. The calculated trajectories are conservative estimates of the magnitudes of the expected changes. The discussion here is on perturbations which will interact with the dynamics system, but for most shots these effects will not greatly affect the balls path (re. accuracy). Another point to take away with you is that the theory does give us insight into what factors are important, and does predict a number of phenomena that we all have seen paintballs exhibit. The magnitude of the changes may be somewhat different, but the mechanisms are the same.
All readers should realize that this section has some speculation in it. I am trying to make the arguments as logical as possible, but the scenarios could be based on false premises, because there is so little real evidence to go on. The reader should think before he leaps.
Environmental Factors Affecting Paintball Flight First, lets take a look at how the external environment affects our calculations. All the constants which depend on atmospheric conditions, such as viscosity and density of air, will change with both the altitude and air temperature. For instance, the density of dry air varies from 1.205 g/L at 20 C and 760 mm Hg to 1.160 at 30 C and 760 mm Hg. So there is roughly a 4 % difference over a 10 temperature range. The viscosity will also change by roughly the same percentage. Moist air is slightly more dense at the same temperatures and pressure, but the difference at the most is less than 0.5 %. Notice that the air pressure is specified when discussing the density. At 25 C the density of moist air changes from 1.186 g/L at 710 mm Hg to 1.231 g/L at 790 mm Hg. The pressure not only varies with highs and lows going through the area, but also the altitude. On the average, Denver must have a lower pressure than Chicago. On the whole, we expect these effects to be relatively minor problems in predicting ball behavior.
Temperature also has other affects. I discussed some of the problems in terms of the Gas law in the Results section, but I did not mention the variation in the balls with temperature. RP Scherer indicates that as temperature rises, a ball will get larger and soften. Although a soft ball may have breakage problems, I wonder if there will be a corresponding better accuracy, because the balls will conform better to the barrel. (Does anyone notice more erratic ball behavior in colder weather?
Humidity is also a problem. Again, RP Scherer suggests that paintballs be stored below 50% humidity, because they will swell otherwise. Swelling will cause more ball breaks in the barrel, and will require more gas to obtain a certain speed.
By the way, local day to day changes in both air pressure, temperature and humidity are also part of the reason your marker doesn’t shoot the same velocity from one day to the next.
Winds are another sure way for the calculations to be off. Winds will have a large effect on the trajectory. Although the distances will change, you will hardly notice their affect if the wind direction is directly behind you or in front of you. Cross winds will definitely be easy to see in the trajectory. The effect of wind velocity is not that difficult to add to the equations, but for the purpose of these pages, it did not need to be considered.
Reliability Due to Measurements We have already seen that once the ball leaves the barrel, there is no more force exerted in the direction of motion. Our perception of the velocity relies on choronograph measurements, and to a smaller extent on our “impression” of the speed. In the latter case, most of us can tell the difference between say 250 fps and 280 fps. But how about 275 and 280. Not really! As we have seen, a change of 5 fps can affect the range by about a couple of inches depending on how far the target is from the marker.
The question is just how accurate is a chronograph? I don’t really have a clue at this point. However, I suspect the accuracy is no better than a couple of percent. Remember, just because an instrument gives a nice digital number doesn’t mean its accurate. If I am correct, about the percentage error than that translates to a +/- 5 ft/s variation with an muzzle exit velocity of 280 ft/s.
Effects due to Barrel Imperfections A new barrel may be cut and polished to the highest tolerances, but it will not remain that way forever. Dust and dirt particles will eventually cause scratches in the finish. Thoughtless cleaning and especially the hurried barrel cleanout we do in the heat of a game can degrade the surface. Dirt is a good scouring agent. How many of us wash the ball wiper before we clean out the barrel on the field? The result is that these imperfections can cause even a perfectly spherical paintball to start spinning and consistently damage the ball’s soft surface. Such damage will cause changes in the airflow around the ball (see next section.)
Effects due to Paintball Imperfections This is the bad one. After thinking about paintball accuracy, and while writing this document, I believe much of the inaccuracy in the sport of paintball is in the nature of the paintballs themselves. Just carefully look through a batch of balls from any manufacturer. All those little dimples and seams affect the dynamics inside or outside the marker. Thus, paintball imperfections are the most likely source where good markmanship will go bad, especially in conjunction with barrel imperfections. I hope this section will convince you of that. Now there is a big caveat. That does not mean every time you miss a target its the paintball’s fault. Only under absolutely controlled conditions can this be proved true. In some cases, the inaccuracy may be related to quality control in paintball manufacture. In many cases, it is related to how the paintballs are stored, used, and abused. The person behind the marker is also a big factor. We should all be more critical of our “abiliities”.
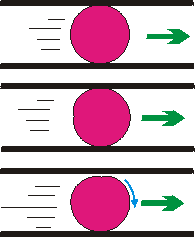 An
misshapen paintball’s interaction with gas and barrel will result in spin. This
can be due to gas blowing past a ball, or nonuniform friction while in the
barrel. The section on paintball statistics shows that paintballs are not
perfect spheres. However, not all ball imperfections will lead to strange
paintball trajectories. It depends on the relative geometry between the
paintball asymmetry (imperfection) and the barrel. Look at the Figure: The top
drawing is the case where a well formed ball is uniformly sealed in the barrel.
The second case is a ball dimpled on the “back” side. This
configuration still has a good symmetric seal between the ball and barrel; there
likely will be no spin developed. However, when the dimple faces the side of the
barrel, as in the third case, the gas can blow past the ball. This leads to a
difference in force due to the flowing gas on the top side and increased
friction on the bottom; there will be a net rotation in this case. In addition,
the gas leakage causes a decrease in linear velocity. So not only will the ball
spin, but it will leave the barrel at a lower speed. I showed in the Results
Section that the lift force due to spin is dependent on the ratio of spin
velocity to linear velocity. In the present case, that means we will see a
larger curve in the ball.
A prominent seam rather than a misshapen paintball is another issue. I suspect if a seam is perfectly uniform around a ball, there will be little effect on the spin of the ball. The reason is that no matter what angle the seam presents to the barrel it symmetrically contacts the barrel at two points (the raised seam). Gas will blow past the ball where the seam does not contact the barrel, but it will be uniform. (Actually there might be a pressure differential when a part of the seam is close to the barrel, but I believe barrel friction overwhelms this effect.) However, this type of problem should lead to vertical changes in the trajectory, because again the gas loss will randomly affect the ball velocity. There is a real possibility that portions of a seam may be more deformable than other portions. Take a look at some paintballs. Often, the seam is not completely symmetrical. Again, this could lead to an asymmetric fitting of the ball in the barrel, causing spin. Keep in mind that the seam will also affect the ball dynamics once the ball leaves the barrel (see below).
Just how much spin will be imparted to the ball by gas escaping nonuniformly around the ball is not clear. I did discuss some very crude estimates in the Results Section, but I don’t have any reliable data on paintball spins. We do know from the references at the end of this article that roughness or shape affects both the drag and lift forces. Go back and examine the graphs for the drag and lift coefficients. Notice how golf balls behave with bottom spin. The rough surface makes a big difference in both the drag and lift coefficients. In terms of the drag coefficient, it makes the ball travel farther. In terms of the lift coefficient, the lift force gets larger. Thats great for helping the ball to go further, since we have seen that this causes the ball to curve upwards. For the flatest trajectory I calculated a spin of 31,000 rpm was needed. That again is based on smooth sphere data. If paintballs cannot be considered as smooth spheres, then much lower spin rates can cause the same behavior.
What about the other 359 degrees the spin axis can assume? Side spin and bottom spin are not you friends. They also will increase as the ball shape deviates from a spherical form or the surface of the paintball becomes rougher. The result will be greater ball curvature at lower speeds. In the case of bottom spin, the ball will drop faster. In the case of side spin, it will curve left or right earlier, ending up much farther off center than the calculations would predict. Worse, the curve may be complex, following even an “S” shaped curve, as I demonstrated in the Results Section.
Spin is not the only mechanism that causes a ball to have a curved trajectory. I have alluded to this problem in the Introduction Section. Have you ever heard of a knuckleball in baseball? Deflection from a normal trajectory can occur even when the ball does not spin or spins very slowly. If a baseball is thrown with the seam just at the right angle relative to the forward motion, a pressure difference results to disruption of the air flow around the ball. The baseball will experience the same type of effect as the Magnus effect. Anything that breaks the perfect spherical symmetry can cause unbalanced aerodynamic forces. This could be a misshapen paintball, a seam, a scratch or a blemish. The result will be an unbalanced pressure differential resulting in some sort of deflection.
However, I doubt that this force due to misshappen paintballs is really a significant contributer to odd trajectories. My reasoning is that the asymmetry of the ball would cause it to rotate even in the barrel and once this happens, it is likely that the effect due to this force will rapidly average out to zero.
Another element I neglected in the calculations was a decrease in spin velocity as a function of distance. The spin should experience a drag effect, but I have no direct evidence of how much. Heck, I don’t even know the typical spin regime for a paintball, let alone the spin drag coefficient. There are a few estimates of this for other sports balls, and the effect does not appear that large. However, the lack of experimental information on paintballs did not warrant including a completely speculative additional calculation.
Effects Due to Air Pockets in Paintballs A last thought about real world paintballs is the asymmetry of the filling (mostly polyethylene glycols) inside a paintball. If the ball has an air pocket that is not exactly at the center of the ball, then the center of mass is not coincident with the ball center. In almost all cases, the air pocket will be near the inside surface, for the same reason bubbles rise to the surface in water.
If the paintball doesn’t spin, then the asymmetry in filling should have no important effect on the trajectory other than that due to mass difference(see later). In the non spin case, there is no relationship betweeen center of mass and the ball’s position or velocity.
For a spinning ball, the offset center of mass could conceivably affect the paintball’s path. To put this in perspective, lets take a look at a couple of real world examples where the center of mass is shifted from the center of a system. First, imagine two different sized pucks connected together by a string sitting on a frictionless (e.g.,air hockey) table. We grab the bigger puck, start it spinning so that the little puck rotates around the bigger one, and then we give the system a shove away from us. What path does the larger puck follow? The system of pucks will move away from us, but the path will describe complex position and velocity oscillations around the center of mass. The net motion will be in the direction we pushed, but the actual path of the larger puck will oscillate from side to side and its forward motion will slow down and speed up as the smaller puck rotates around the larger one.
Another example is the hunt for planets in other star systems. The old way of doing this was to watch for oscillations in the position of a sun over a long period of time indicating that some large nearby body was pulling the sun out of position as the “planetary” body rotated around it. (The current way is to watch for Doppler shifts in a stars spectral lines.) Now a paintball may not be a sun, but the dynamics are similar. Just as with the sun/planet system the mass is not symmetrically distributed in space. Except in our case we don’t have more mass to worry about; we have missing mass. That should not really matter. We have a center of mass that is not coincident with the center of rotation.
However, there is another, so far neglected, factor here which will make any further discussion of this bubble effect moot. Given time, the air pocket will rise to the top of the fluid and end up against the inside skin of the ball. The fluid in the ball is viscous, so that in a game, even as the balls are jostled and moved, the fluid will tend to stay on the inner wall. Once the ball starts spinning the air pocket experiences a centrifugal force and will begin to move to the center of the ball. This occurs because air has a much lower density than the fluid by several orders of magnitude. Its the same reason heavy particles settle in water in a centrifuge. As the air bubble moves toward the spin axis (nominally the ball center), the center of mass also moves to the center.
Although I will not show the calculation details (it is based on Stokes Law applied to particles in sedimentation centrifuges), if I assume the following conditions: air pocket = 4 mm dia., bubble starting at inner wall, fill viscosity = 310 centpoises, and fill density = 1.16 g/cc , and the spin is 1000 rpm, it takes about 0.6 s for the air bubble to come close to the center of the ball(0.1 cm). This relatively long time to reach center means that there could indeed be an effect on trajectory due to an air bubble. Look back at the trajectory data. You will see that for practical ranges this time is of the same order as that to hit a target. Thats not good news, it suggests there could be an effect. However, lets pursue this a little further.
Just how will this 4 mm bubble affect the center of mass? Imagine that we divide a paintball in two; one half contains the air bubble plus fill, and the other only fill. Now lets say we can place all the mass of each half at the edge of the ball. We can calculate that the center of mass will shift from the center of the ball 0.1 millimeters toward the mass with no air pocket. Thats not a very large shift and moreover, I have biased the center of mass calculation in favor of the worst possible case. The mass of the ball is really concentrated much closer to the center (remember its a sphere). In addtion, while spinning through the air the bubble will definitely move toward the center. (There are ways to get a more accurate answer, but I don’t think its really worth the effort.) The result is that the center of mass really won’t be much different from the center of the ball.
Based on the above analysis, I believe the presence of air in the ball will not cause noticibly erratic trajectories. There will be no wild gyrations due to air bubbles in the fill.
However there is twist to the air pocket problem. Variable amounts of fill means variable mass for the ball. Assuming a marker always delivers the same amount of gas to produce the same amount of force on a ball, a lighter ball will leave the muzzle with a higher velocity. This will cause the ball to go further. This effect is proportional to the force. Based on our previous scenario with a 4 mm bubble, the change in mass is ~ 1.2%. This would mean a +3 ft/s change in velocity. To be honest, that big a change in velocity is unlikely. From our paintball statistics page, the mass variation is only 0.2 % for good quality paintballs.
Explorations (How can you help!) Some experiments for you to try: Physics teachers - you can develop a lesson plan around some of these. Kids - lets not forget those science fairs your science teacher is always trying to get you to submit a project for. Professional scientists or engineers - if I can spend some of my personal time on this, so can you. Its your duty to the paintball community and society!
Note since the original of these pages was published, I have it from a good source that at least some of the needed data already exists. Sadly, but understandably, this data will probably never see the light of day for a variety of proprietary reasons.
By now, if you have managed to slog your way through all this, some of the most obvious problems and needs are already evident to you. However, I will compile the ones that stuck out for me, along with some hints at good scientific practice. However, I do not intend to write down all the scientific protocols necessary. Particularly for science projects, I don’t want to make the task too easy. I give only a few hints to start you thinking (but see last section here). Moreover, I certainly don’t have all the answers.
What is the Trajectory and Range of Paintballs? Anyone with a lot of open space, a good tape measure, a protractor (or better a transit), at least one chrono, and a maybe a video camera can get into the act here. The question is how well do the simple trajectory calculations match with reality. Are my numbers even close? Before you run out the door to start this project, read this entire manuscript over a couple of times. It will give you insight into all the factors you need to be aware of to provide reliable data. What would I like to see? Well at a minimum, if a video camera would pick it up, the entire trajectory. Also, the point where the ball hits the ground in terms of distance from marker and lateral deflection, and how long the ball took to get there. With a very good extensive set of data, we can work backwards to define better drag and lift coefficients. As a starter read the Lapco Challenge which I discussed in the Relevance Section.
Flatter Trajectories? I discussed the fact that topspin could produce a flatter trajectory at low spin rates. However, if a marker produced backspin at high spin rate, an even flatter and longer trajectory can be produced. In general, this is what we would like to see all the time. As I already mentioned several manufacturers have come up with bolts that try to produce spin on the ball. These do not seem to be very popular. The unsupported reason given by several people is that they also cause dispersion as well.
The curved barrel by Tippmann Pneumatics is another way of producing spinning paintballs. Admittedly, I have great hopes for this method.
Another way of placing spin on the ball that I have not heard anyone using yet would be to use a slighlty oversized egg shapped barrel with the small end at the bottom so that gas can blow past the ball causing back spin. Remember you saw the concept here first!
Well, here is one anyone can try. Place a very thin film of tape on the top of the muzzle to create drag and hopefully backspin. If the spin is high enough, you will see a small change to a flatter trajectory. Hopefully, the balls won’t break and the tape will hold for more than a few shots. Can you think of other ways to do this (without ruining a barrel)? Note: The change may not be much, and as I have already discussed there are a host of other problems to worry about. It could be easy to fool yourself into believing its true. How can you check this?
Find the range of spin velocities So just what is the spin velocity range of a paintball? I discussed it in some very crude terms, but I would sure like to see real data. Is there a way to do this without a strobe?
Drag and lift coefficients for paintballs For those with wind tunnels in their basement, just what are the drag and lift coefficients for spherical, ovoid or odd shaped paintballs. How about seams? This one is tough for the average citizen, and I would be surprised if even professionals would can get wind tunnel time for paintball research. But we need those dynamic coefficients!
How do you break a paintball? Now here is one we all can do with the proper thinking about controls. In paintball, a hit is only counted if the ball breaks and there is at least a dime sized spray of paint on you.(The size varies from field to field.) Therefore, just what are the minimum requirements for a ball to break. I calculated that there is a very rapid falloff of velocity with distance, and discussed several studies related to paintball breakage. The data is in need of controlled scientific experiments. Does “long balling” really do anything, other than scare novice players, and keep you from getting bored on the field? What is the minimum speed to break a paintball when it contacts a surface? Now be careful with this. It is not quite as simple as it sounds. First, you need to know the balls speed accurately at the point of impact. Two chronos would be a real asset. Both hard surfaces, and soft surfaces that mimic the resilience of skin and clothes need to be considered. Then start angling these surfaces relative to the ball direction. Maybe you should also think about shapes like cylinders to represent arms and legs. Oh, and don’t forget to measure the temperature, and humidity. For the real daredevils, worry about different manufacturers, shell thickness, elasticity and several other factors I will leave to your creative imagination.
This one is for the very advanced mathematician players: My feeling is that most of the accuracy problems are in the paintballs, not the markers (maybe players too!). Applying group theory, (symmetry groups) and statistical analysis to the problem of paintball deflection would be fun, and might just be useful. Of course, it wouldn’t hurt to measure and quantify a variety of imperfections or asymmetries in paintballs to compare with theory. Of course, this project assumes that those with this kind of mathematical knowledge have even heard of paintball.
Temperature changes and markers Another interesting point is what are the temperature changes over time in the gun. I mentioned that temperature has a big effect on pressure, and pressure is critical to constant velocity. So what are the variations? The temperature will directly impact you accuracy.
The Holy Grail Experiment The problem of large bore barrels and non matched paintballs is well known. However, as noted in the Lapco Barrel Challenge and suggested in the previous section, there are still some strange things going on. So we have the ULTIMATE EXPERIMENT. An extremely challenging research project that will require real work, real thought and real money to do correctly. Unless you have access to a precision machine shop, and are very clever, it’s a tough one to do right. You will also need precision equipment for delivering air and spinning balls. In addition, expensive high speed camera’s are a must. Apparently, Air Designs did some work along these lines quite awhile ago, but the results are not completely in the public domain. (AD certainly has the right not to put them there.) I have only heard about some of the results. We need experiments that don’t use paintballs, but use precision balls that have different sizes and different imperfections (like a seam!) Plastic balls would be fine if the tolerances can be held and established.
Why not use paintballs? Because paintballs are subject to humidity, preparation conditions, conditioning, pressure variations, temperature, filling factors, chemical aging, probably microbial decay and I am sure a few things I missed. We need to remove the effect of those variables. The relationships between seam orientation, sphericity, velocity, barrel length, pressure, bore size/ball size ratio and a few other variables needs to be locked down and understood. Then you start shooting paint.
Discussing or Arguing Ideas with Me As far as I know this is the first document of its kind on paintballs. I would seriously like comments and suggestions to improve the scope and impact of this document. (Two, that I already know: its long, and its complex. Hey, you have to start somewhere!)
As far as people contributing to these problems, I would dearly love to have reliable experimental information. However, there are a couple of caveats: First, I do not have the storage space or the time to host and maintain other peoples work. I would gladly include a web reference or published reference, and discuss their results somewhere in these pages. (The one possible exception to this is what I deem critical data by someone without any web page access.)
Second, you should be thick skinned. If you submit your results or a reference to me for comment, I will give them my full attention. I am a professional scientist (a chemist, not a physicist), and will examine your work with the same scrutiny I use in my own work, and those of my colleagues. I don’t care if your ideas or results conflict with what I have said here, but I do care about properly documented and well thought out work. You can expect a critical review about a subject that I have become a little familiar with. Remember, however, that I too am out of my natural element with much of this stuff.
If you are trying to come up with experiments to solve a problem, I will offer advice only if you show me you have thought about the problem yourself first. Basically, this is the same rule used in many of the sci.* newsgroups. I don’t do homework for students.
Conclusions I have truly enjoyed doing this, but it took a whole lot of personal time. (Thank God for cold winters!) My wife thinks I am nuts, and has given me more than one of those wife to husband sighs. (She really is a nice person though.) My son is upset because I tied up our home computer for evenings and weekends on end and he can’t play games. (As a teenager, sometimes he’s a nice person.) And you want conclusions? Sorry, all you get is advice, read everything over again and again. The conclusions are already there, and plenty of speculation. Now its your turn to think about this stuff.
I probably will be adding to this as I get the chance, but it will take time.
REFERENCES (Where did we take all this stuff from?)
The following do not represent all the references that I used, but they do represent those that were most critical in preparing this work:
Briggs, L. J., Effects of Spin and speed on the lateral deflection of a baseball; and the Magnus effect for smooth spheres. Amer. J. Physics, 27, 589-596 (1959).
Achenbach. E., Experiments of the flow past spheres at very high Reynolds numbers; Amer. J. Physics, 54, 565-575 (1972).
Watts, R. G.and Baroni, S., Baseball-bat collisions and the resulting trajectories of spinning balls; Amer. J. Physics, 57, 40-45 (1989).
Davies, J.M., The Aerodynamics of Golf Balls; J. Applied Physics, 20, 821-828 (1949).
McPhee, J. J., and Andrews, G.C., Effect of sidespin and wind on projectile trajectory, with particular application to golf; Amer. J. Physics, 56, 933-939 (1988).
Erlichson, H., Maximum projectile range with drag and lift, with particular application to golf. 51, 357-361 (1983).
Gould, H. and Tobochnik, J.,An Introduction to Computer Simulation Methods. Applications to Physical Sciences, 2nd Edition, Addision-Wesley, p38-49.
MacDonald, W.M. and Hanzely, S., The physics of the drive in golf. Amer. J. Physics, 59, 213-218 (1991).
Mehta, R.D., Aerodynamics of Sports Balls, Annual Reviews of Fluid Mech. 17, 151-189, (1985).
The following represent some non exhaustive hyperlinks on aspects of ball mechanics and aerodynamics that have been brought to my attention. or I have found, that might aid the reader into a better understanding of the aerodynamics of sports balls and spheres. Some of these site have some very nice graphics and explanations that could smooth out some of my more confusing explanations:
Forces Acting on Airborne Particles Effects of spin on the motion of a ball The K-8 Aeronautics Internet Textbook and especially the Aerodynamics in Sports Technology section. The Magnus Effect. The Science of Swing
Computation Details for the Curious and Unsuspecting
Unless you are really getting excited about doing your own calculations or may be refining those presented here, you may wish to skip this section. We are going to wallow in some of the nitty-gritty details needed to solve the equations. It also will assume the reader is familiar with physics and computer programing.
drag coefficient calculation-non spinning case The drag coefficient on a non spinning ball was calculated using the data of Achenbach That is displayed in the section on the Magnus Effect. To obtain the proper value of the drag coefficient at every time interval, the curve was fit to an arbitrary function of a type known as a rational equation. The points to fit were manually transcribed off the published graph.
Rational equations have the general form:
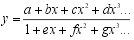 There are many software programs which have regression routines to fit data to
specific functions. SigmaPlot (ver 4.0), a scientific graphing program which has
regression capabilities, was used to do a least squares minimization to find the
constants a-g. The points shown in the Achenbach figure were the data from the
experimental plot. The line represents the actual fitted data.
drag and lift coefficient-spinning case
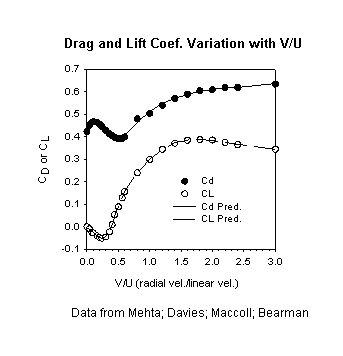 In a similar
manner, the data for the drag and lift coefficients for the spinning paintball
were calculated using a rational equation. Two sets of data were merged for
this, the data from Davies and the high V/U data from Maccoll. This was
necessary because paintballs will achieve V/U values of around 3 near the end of
their flight. The Davies data only goes to 0.56. The fit to the Davies/Maccoll
data is shown at the right. The points are the data taken from Davies and
Maccoll figures, and the line represents the fit. However, there is a
complication in the calculation of the drag coefficient data for a spinning
paintball. The data by Davies was generated at somewhere around 105 ft/s, and
the data replotted by Bearman and Harvey is in terms of V/U (spin
velocity/linear velocity). The Reynold’s number for Davies data was ~9 x 10⁵and shows a value of 0.42 at zero spin velocity. Achenbach’s data shows a
value of 0.50 in this same Reynolds number region. To get adequate
correspondance between spin and non spin data, it was necessary to scale the
Davies drag data according to the Achenbach data. To do this, a first order
correction was applied: The Achenbach data was used to find the CD
for the non spinning case, and this value was substituted in the “a”
value of the rational equation for Davies spinning ball rational fitting
equation. (The first constant “a” represents the zero spin case,
because V/U = 0.) This assumes that the relationship between CD and
V/U of Davies spinning sphere data are the same at all relevant Reynold numbers.
This assumption has not been proved, but I believe it is valid enough for the
calculations here. This generally brings up a point that CL data
would be better plotted not as rotational velocity/linear velocity (V/U), but
rotational velocity/Reynolds number (V/Re). The constants for all the different
rational equations that were fitted to the data can be obtained from the source
program.
Also, I considered that the spin velocity was constant throughout the entire flight. This assumption is not realistic. The air resistance around the ball would likely cause the spin rate to decrease. The question is how fast. Some people on the rec.sport.paintball group think that it will be damped very fast,within a short distance from the gun. Others like me are not so sure. I believe a rough answer to this question is already available somewhere in the fluid dynamics literature. I just have not had time to dig it out. Until I or someone else does, I will assume the the drag effect on spin is small and therefore negligible. Realize that the answer to this could make a real change in my estimations of spin effects.
equations of motion integration The equations of motion were solved using the Euler-Richardson numerical integration method. The code was based on an example in the book by Gould and Tobochnik (see references); this was modified for the 3D case here. I found this method particularly easy for following the programing logic. A better integration method probably is a Runge-Kutta strategy. This may someday make its way into the Java version of the program, but required more work intially then I had time for. The time interval was fixed at 0.001 seconds. Most trajectories were on the order of 3- 5 seconds, so that 3k-5K calculation cycles were needed. On my PII/400 the time for most simple trajectory calculations was under ten seconds, even in the worst cases. The original coding for all the results produced here were written in Excel 97 brand of Visual Basic so that all the calculated values could be dumped to a spreadsheet. All the graph information displayed here is the result of some variant of the Visual Basic code.
Once all the coding and debugging were completed, the code was ported to Java code for trajectories used in the trajectory calculator. Details of this can be found in the trajectory calculator page.
The original VBA coding turned out to be straightforward. Converting to the proper units produced the most frustration. The program uses three measuring systems: The trajectory calculations use the mks system, while the calculation of the CL and CD constants used the cgs system. There are two functions to obtain these numbers. Since many of the readers are still mired in the old English system, the metric units were then converted to English units at the end for output. The interested reader will find that there are a lot of comments in the java code to help follow the logic. This is not only for you. If I decide to extend the calculations, I doubt in a couple of months I will remember what I did. Moreover, I do not write code for a living, but do have to use it occasionally.
All Information provided has been generously submitted by Gary Dyrkacz, and original site content from http://home.comcast.net/~dyrgcmn/home.html